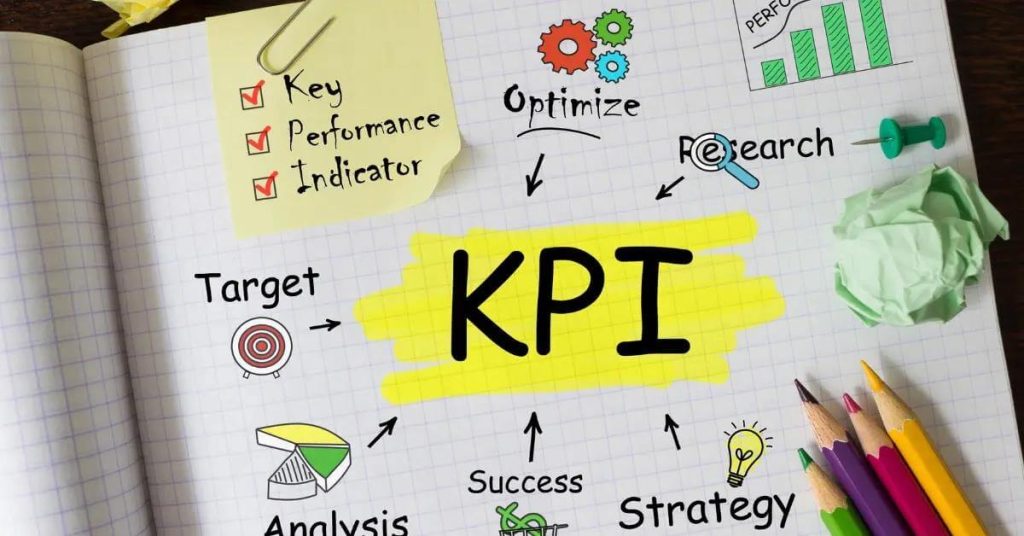
Have you ever thought about the secret ingredients that go into a successful beverage company? It’s not just water, sugar, and flavorings. The real game-changers are hidden in numbers – ratios, percentages, days of inventory, or sales outstanding. These are beverage company KPIs (key performance indicators), the lifeline of any thriving business.
I remember my first deep dive into this world. Like navigating an intricate maze with no clear exit point – exhilarating yet overwhelming! As I grappled with terms like ‘days sales’ and ‘average order’, I felt like a child learning to speak for the first time; each new word was a triumph!
Beverage company KPI is more than mere jargon. It’s like the traffic signals on our roads, guiding us when we’re uncertain about the next turn in our journey toward profitability.
Understanding Beverage Company KPIs
The world of beverages is an ocean where companies are ships, sailing towards success. To navigate these waters, beverage manufacturers need a compass and that’s where Key Performance Indicators (KPIs) come into play.
The Role of KPI in the Beverage Industry
KPIs act as the North Star for beverage companies by providing insights to measure their efficiency and effectiveness. From monitoring production lines to optimizing operating expenses, they help firms chart a course through rough seas toward strategic goals.
A significant part of decision-making relies on tracking key performance indicators like ‘Days Sales’ or ‘Average Order’. By using this data, managers can fine-tune business processes and make more informed decisions about raw materials use or new product launches.
The Brewery Financial Model, an essential tool for any budding brewer out there helps track such metrics effectively. It gives you real-time updates on your sales numbers so you can tweak your strategies if required.
You see, knowing how many days inventory remains at hand or calculating average order values isn’t just number crunching; it’s like reading tea leaves that reveal future trends. Software solutions designed specifically for KPI tracking take all guesswork out of this process – letting businesses focus on what they do best: creating delicious drinks.
“There’s nothing ‘soft’ about soft drinks when it comes to hard facts.”
Essential Beverage Company KPIs To Track
The beverage industry, just like any other business sector, relies on key performance indicators (KPIs) to measure and improve operations. By keeping an eye on specific metrics such as inventory turnover, distribution cost, and working capital metric, companies can gain insights into their financial health.
Profitability Metrics in Beverage Companies
To start with profitability metrics – it’s all about the numbers. Gross margin per unit gives you a snapshot of how much profit you make from each product sold after accounting for production costs. EBITDA per item is another essential metric that demonstrates your organization’s earnings before subtracting interest, taxes, depreciation, and amortization.
Gross margin isn’t just about total revenue; it also helps evaluate customer satisfaction levels by looking at repeat orders. Cash flow too plays a crucial role here. When cash inflow exceeds outflow (Key Stat 6), businesses get more breathing room to invest in growth opportunities or weather unexpected challenges.
Operational Efficiency Metrics
Moving onto operational efficiency – these metrics help gauge how well resources are used within the firm. Throughput measures the rate at which products move through the production lines without interruptions or delays. Higher throughput equals better productivity.
In contrast, “utilization rate” (Key Stat 7) shows what percentage of available time was actually productive operating time. A high utilization rate indicates effective use of resources and minimized downtime. Maintenance management is a key aspect here, as regular equipment upkeep helps ensure optimal performance.
Wrapping up, remember that these KPIs are more than just digits. They give you a clear view of your company’s operations and highlight areas needing some tune-up. Keeping an eye on these crucial metrics will always keep you one step ahead.
Key Takeaway:
For beverage companies, essential KPIs like inventory turnover and distribution cost offer a clear view of financial health. Profitability metrics such as gross margin per unit reveal profit after production costs while operational efficiency metrics like throughput indicate resource use effectiveness.
Regularly monitoring these numbers lets you spot areas that need tweaking to stay ahead.
Tracking and Monitoring KPIs in the Beverage Industry
In today’s highly competitive market, effectively tracking and monitoring key performance indicators (KPIs) is crucial for any beverage company. It not only helps you to gauge your operating costs but also enables strategic decision-making.
Importance of Real-Time Tracking
The ability to track progress with real-time data offers significant advantages. For instance, keeping a close eye on metrics like fill rate and average order value can provide insights into how well business processes are performing. This kind of timely information lets companies make swift adjustments when necessary.
Take the day’s sales outstanding as an example: this critical KPI measures how long it takes a company to collect payment after a sale has been made. A high number might indicate that customers are slow to pay their invoices, which could tie up the cash flow needed for other operations such as purchasing raw materials or covering operating expenses.
Another key indicator often tracked by beverage companies is inventory turnover – the rate at which stock is sold and replaced over a given period. High turnover rates suggest strong sales while low rates may point towards outdated or surplus stock — important signals that help guide production line decisions.
An effective financial model, allows us to keep tabs on these metrics seamlessly thereby enhancing our decision-making process significantly.
Apart from profitability figures, understanding customer behavior through factors like average order value plays a pivotal role too. If customers consistently place large orders then we’re likely meeting their needs effectively but if they’re ordering less frequently or smaller amounts then there’s room for improvement.
KPI tracking isn’t just about numbers, it’s also a valuable tool for improving customer satisfaction. By monitoring these metrics closely, beverage companies can make necessary adjustments to their business model ensuring they remain competitive in the market.
With the help of software solutions, businesses are finding it easier to handle all this information. These tools take care of data collection and analysis, letting managers concentrate on bigger-picture goals.
Key Takeaway:
insights. These insights can shape your strategies and lead to better results. So, by keeping an eye on these metrics, you’re not just tracking numbers – you’re staying ahead of the game. High or low inventory turnover? It tells a story.
Understanding customer behavior through average order value? That’s another piece of the puzzle that can help drive success in this competitive industry.
Effective KPIs for Inventory Management in Beverage Companies
Beverage companies face a challenging balancing act when managing inventory. It’s not just about keeping enough stock to fulfill orders but also avoiding excess that can lead to spoilage or obsolescence, especially with perishable items like fresh juices.
The key performance indicator (KPI) of ‘days inventory’ offers crucial insights into this balance. It measures the average time products stay in your warehouse before they’re shipped out. A lower number indicates quick turnover, which is usually good—but if it’s too low, you might be risking stockouts and lost sales.
This Computerized Maintenance Management System helps track this critical KPI along with others vital for effective inventory management.
Distribution Costs and Inventory Turnover Ratio
In addition to days inventory, two other essential KPIs are distribution costs as a percentage of sales and the inventory turnover ratio.
‘Distribution costs as a percent of sales’ gives an understanding of how efficiently you’re moving goods from production lines to customers—a high rate may indicate room for improvement in your delivery processes or routes.
Your ‘inventory turnover ratio’, on the other hand, shows how often during a year you sell through all your stocked goods—it’s calculated by dividing total revenue by the average value held in stock. High values mean fast-moving products; low ones could suggest overstocking or slow sellers—both signs you need adjustments.
Remember, though each industry has its benchmarks—the goal should always be continuous improvement.
Sales Outstanding Days – Another Critical Metric
Last but not least among our selected beverage company KPIs is ‘days sales outstanding’. This figure demonstrates the average length of time it requires for clients to pay their bills. A lower number of days means you’re collecting payment faster—which improves cash flow.
Understanding and tracking these metrics is key. They give insight into your business processes, guiding decisions like tweaking order quantities or renegotiating supplier contracts.
Key Takeaway:
Optimizing inventory management in beverage companies is a tricky balance, but key KPIs can guide the way. ‘Days Inventory’ sheds light on product turnover speed. Meanwhile, ‘Distribution Costs as Percent of Sales’ and ‘Inventory Turnover Ratio’ provide insights into delivery efficiency and stock movement frequency respectively.
Lastly, it’s important to keep track of your ‘Days Sales Outstanding’ as this metric offers crucial information about how quickly you’re getting paid after making a sale.
Analyzing Financial KPIs for Beverage Companies
Financial Key Performance Indicators (KPIs) play a pivotal role in the beverage industry. They give us insight into the health and profitability of companies. One such critical KPI is cash flow.
Cash Flow Analysis
Cash flow, often overlooked, serves as an essential indicator of financial stability within any company. It’s like the lifeblood flowing through your body – without it, you’re not going to get very far. Understanding how to eliminate waste can significantly improve cash flow, particularly in industries dealing with perishable goods such as beverages.
Keeping track of operating expenses and labor costs is also vital because they directly impact gross margin and ultimately, cash flow. Remember this: A positive cash flow can make all the difference between thriving or merely surviving.
Besides that, stat 6 reveals how a high inventory turnover rate contributes positively towards a good liquidity position whereas low turnover indicates excessive stock leading to unnecessary storage costs which could affect gross margin adversely (a.k.a your bottom line gets hit where it hurts most.).
Similarly, stat 7 emphasizes reducing goods sold expense by smart sourcing raw materials thereby increasing overall profit margins and further boosting healthy cash flows.
Last but not least, we have our key stat number 10 which signifies the importance of efficient operations and effective resource utilization. But don’t just take my word for it; dive deeper into understanding these brewery financial models for more insight.
So, if you’re in the beverage business and aren’t analyzing these KPIs yet, it’s high time to start. Remember, knowing your numbers is not just smart – it’s essential.
The Role of KPIs in Strategic Decision-Making for Beverage Companies
Key Performance Indicators (KPIs) play a critical role in guiding strategic decision-making within beverage companies. They help identify areas that need improvement and track progress toward the organization’s strategic goals.
Using Break-even Point for Strategic Decisions
To make informed decisions, understanding your break-even point is crucial. This measure gives you insights into how much product needs to be sold before profits start rolling in. But it’s not just about total capacity or raw materials; knowing this key indicator can guide pricing and production strategies too.
In our experience at MetaBrand, we’ve seen firsthand how adjusting these variables based on the break-even point has led to more profitable operations. The result? More capital is available to invest back into growing the business (Maintenance Planning and Scheduling).
KPIs: Your Company’s Crystal Ball
You might wonder if KPI measures are really that important when operating costs, orders fulfilled rate distribution costs among others seem more pressing concerns day-to-day. Let me tell you – they’re like a crystal ball.
A critical KPI such as ‘Days Inventory’ tells us how long inventory sits idle without generating revenue. It provides insight into whether we’re holding onto excess stock which could lead to higher storage costs or even spoilage of perishable items.
This kind of data allows beverage companies like ours to adjust procurement processes, manage raw materials better, and optimize production lines thus improving overall efficiency. And yes, that directly impacts bottom-line profitability.
Tracking KPIs: The Key to Progress
KPI tracking is not a one-time activity but an ongoing process. Real-time monitoring helps track key performance indicators and provides insights into the operational health of the company. For instance, knowing our ‘Orders Shipped Rate’ allows us to identify any bottlenecks in order fulfillment – ensuring customer satisfaction isn’t compromised.
Key Takeaway:
Mastering KPIs is like peering into a crystal ball for beverage companies. These critical indicators not only highlight areas needing improvement but also guide strategic decisions from pricing to production.
Understanding your break-even point can lead to more profitable operations while tracking metrics such as ‘Days Inventory’ and ‘Orders Shipped Rate’ optimizes efficiency and customer satisfaction.
Implementing KPI Tracking Solutions in the Beverage Industry
In a fast-paced industry like beverages, balancing highest highest-level operations with tracking perishable items can be challenging. KPIs provide useful information to assist in setting objectives and making decisions for beverage businesses.
KPIs give valuable insights that help you set goals and make strategic decisions for your beverage company. But how do you start tracking these critical indicators?
The answer lies in implementing effective KPI-tracking solutions. These tools let us monitor our key performance indicators such as days sales, average order size, operating costs, and more – providing a clearer picture of business processes to aid decision-making.
The Challenge: Monitoring KPIs Amidst Operating Expenses
It’s no secret – keeping tabs on operating expenses while ensuring efficient production lines is a difficult balance to strike in any sector, especially so within the beverage industry due to its unique challenges involving perishable raw materials.
A smart approach? Utilizing software solutions designed specifically for this purpose. For instance, inventory management systems like CMMS (Computerized Maintenance Management System), provide detailed data on your stock levels including ‘days inventory’, helping manage costs effectively.
Leveraging Software Solutions for Real-Time Insights
We’ve seen time and again that real-time monitoring of orders fulfilled or shipped drastically improves response times to market changes or customer demands – another reason why choosing suitable software solutions becomes crucially important.
You see, not only do they enable seamless track progress toward strategic objectives but also allow rapid adjustments if required. Maintenance Planning and Scheduling software, for instance, can help streamline business processes in this regard.
The Payoff: Strategic Goals Achieved Through KPIs
By tracking these key metrics, we get a complete picture of how the business is doing. From raw materials to fulfilled orders, these tools let us see everything in detail and give valuable insights into our organization’s performance.
Key Takeaway:
Mastering the beverage industry’s fast pace calls for smart use of KPIs. To balance top-level operations and perishable items, implement effective tracking tools that let you monitor vital indicators like days sales and operating costs.
Embrace software solutions like inventory management systems to keep an eye on stock levels, respond swiftly to market shifts, and drive strategic goals.
Optimize Your Beverage Company KPIs with MetaBrand
Steering a beverage company to success is like navigating an intricate maze. But armed with the right metrics, it’s less daunting.
From profitability and operational efficiency to inventory management and strategic decision-making – each aspect needs careful attention. It’s clear now how vital beverage company KPI tracking is.
We’ve seen that understanding terms like ‘days sales’ or ‘average order’ isn’t just for show. They are critical tools guiding your journey toward profitability.
In essence, the secret ingredients aren’t hidden in bottles but within ratios, percentages, and days of key performance indicators!
Contact MetaBrand to optimize your beverage company KPIs!


